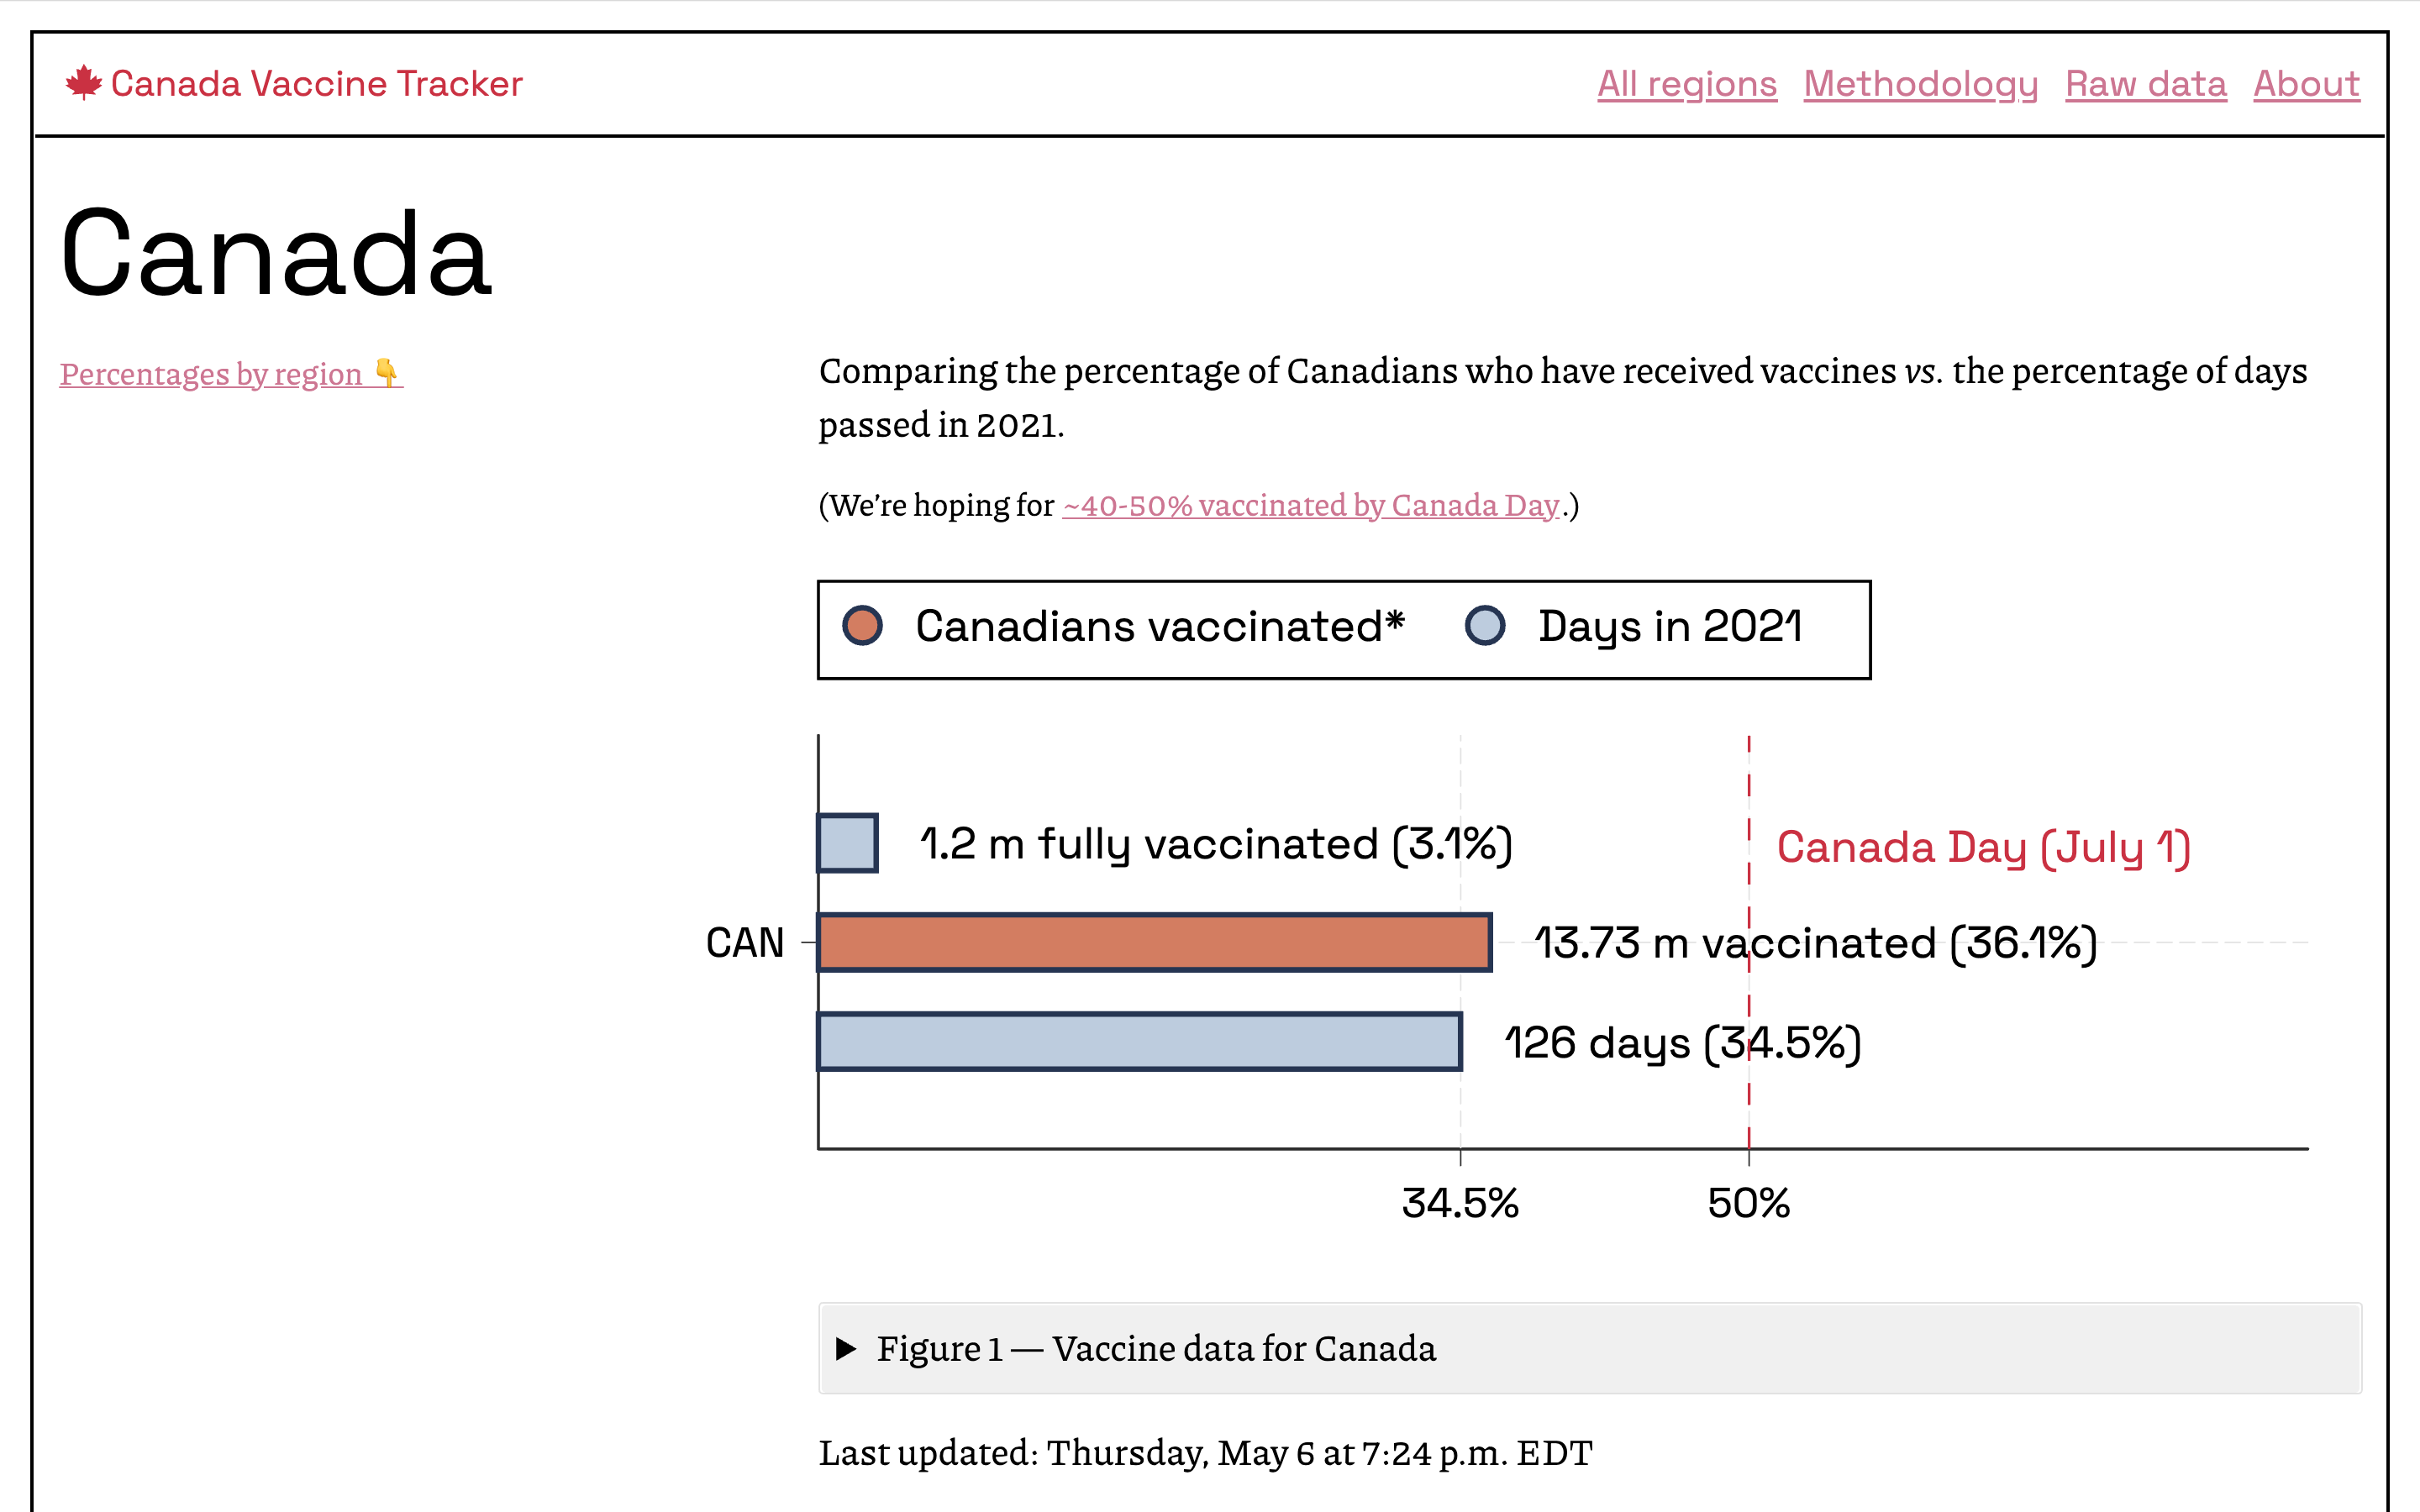
canada-vaccine-tracker.ca
Graphing vaccines over time

In January 2021, I designed, built, and shipped canada-vaccine-tracker.ca, an auto-updating progress tracker that gave you the headline figure and then got out of the way.
During January’s provincial lockdown, vaccines were a hot news item but still scarce in Canada, meanwhile the government was predicting 15-25 million people vaccinated in a few months (effectively, half of Canadians halfway through the year). The core idea here was to compare the progress of vaccines vs. the progress of the year.
The site is built in Next.js, and pulls its data from the COVID19Tracker.ca API. It was my first time using graphs extensively since the Performance Platform, and it was fun thinking through how to build them with accessibility in mind. It was also fun to get away from the Canada.ca Design System and the pcraig.ca design language for a few weeks (although arguably it’s a dialect).
The good outcome here was building a working app and shipping it in under a week. Sometimes government technology groups want to spend 12 months deciding that 10-year old tech is too cutting-edge to use just yet, so it’s nice to just push some code, share it with friends, and get some minor plaudits on Twitter. Sometimes the real treasure is the 6 likes we made along the way.